BDC Market Snapshot: Week Ended May 26, 2023
Not Much
A 0.5% increase in BDC prices during the week ended May 26, 2023 - in which half the players we track moved up in price and half moved down - didn't move the key metrics we track every week by very much. As we've been discussing at much greater length in BDC Reporter's Common Stocks Market Recap, prices have been trading in a narrow range for over two months. As a result, with only small tweaks undertaken to dividend projections, BDC total return expectations and projected 2023 yields have barely budged. If you go to the Expected Return Table and scroll down, you'll see we keep a record of the key metrics from week to week, and the end of May looks very much like the end of March.
Left Behind
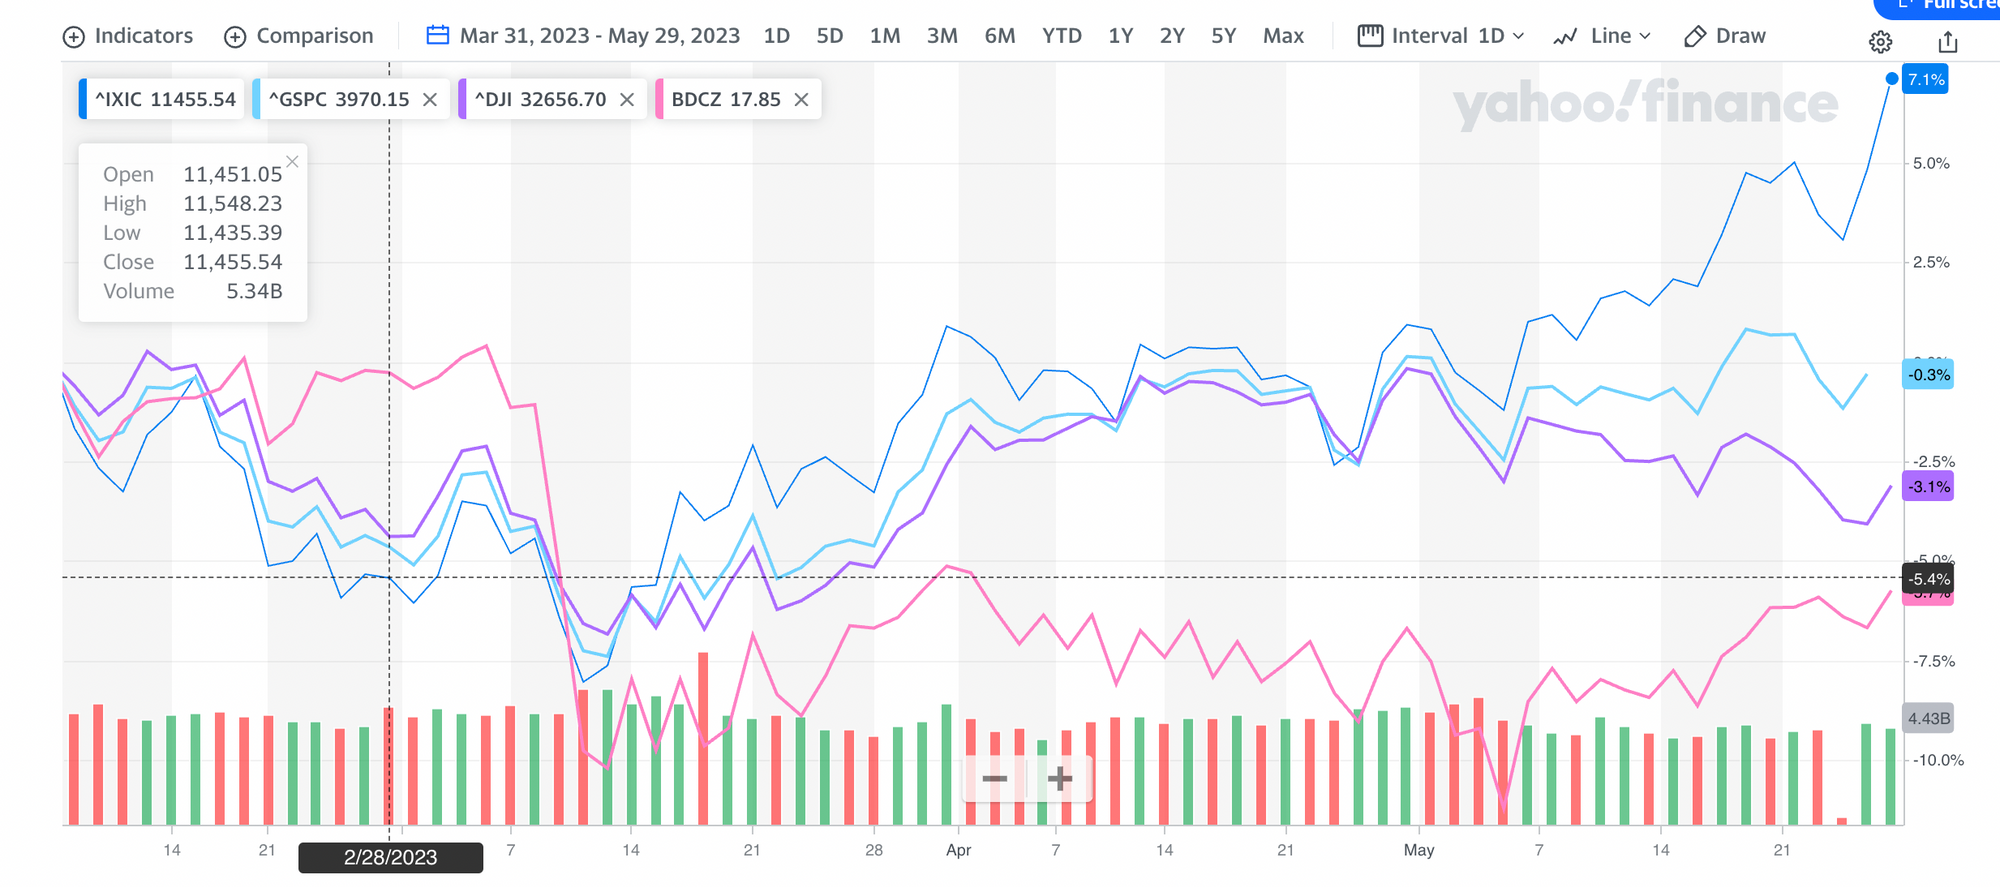
As this chart below perfectly illustrates, the NASDAQ, S&P 500 and even the Dow have been turning up since the end of March, but the BDC sector (BDCZ) has not:
The Good News
This leaves would-be long-term BDC investors - or at least those in sympathy with our projections - access to the same outsized returns that have been around all year, especially since the Silicon Valley Bank (SVB) collapse.
Valuation
Latest
We're continuously updating the Expected Return Table in one way or many. This week, we input all the latest analyst earnings projections for 2023 and 2024. This is not apple-for-apple data as sometimes the analysts use GAAP numbers and sometimes non-GAAP. Also, some of the projections are on a calendar year basis and others are based on the BDC's fiscal year. Nonetheless, this is interesting data and provides a good sense of the trends underway.
Historic Update
We also updated - using Seeking Alpha data - the historic 5-year total returns for every BDC that's been around for that long a period. These numbers provide a useful comparison with our own projections of future total return performance. At the moment, the future looks more promising than the past, where the average 5-year return was 48%. (Still, there are 4 BDCs that boast a 100% plus return, even though the sector has been through the Covid-pandemic and the current slump).
Lesson Confirmed
What we find most encouraging in the data from those 35 BDCs with a 5 year trading record is that 28 have achieved a positive return despite many macro challenges faced. BDC Best Ideas is a great believer in a "have and hold" investment strategy where BDCs are concerned, largely based on those sorts of metrics. The rule that requires BDCs to pay out almost all their earnings in the form of distributions almost guarantees long-term investors a solid total return. Of the 35 BDCs evaluated, only 11 have a higher stock price today than 5 years ago, yet 80% have generated a gain overall when dividends are figured in. With BDC yields currently higher than ever before, the future seems even brighter.
Revisited
As mentioned last week, we've also given some thought to PennantPark Investment's (PNNT) future prospects. The BDC is entering a new phase after finally shedding its largest remaining oil and gas investment in the most recent quarter and booking a huge realized loss. Management - properly chastened by its ill-advised investing in the energy patch - has re-positioned itself into lending and investing in more conventional middle market companies (EBITDA up to $50mn). That's where PNNT had great success in years gone by.
Latest Metrics
We've increased our dividend projection for 2023-2027. This year, the dividend goes from $0.7400 to $0.7850 and rises to $0.8000 for the remaining years. If we're right about the payout for 2023, that will represent a 31% increase over the actual result for 2022. The total return PNNT promises is now 142%, or 28.4% per annum, which includes a 14.0% yield in 2023. Despite that likely huge increase in its 2023 payout over 2022, PNNT is trading at a (26%) discount to its net book value per share and 6.2x projected 2023 EPS.
Future NAVPS
Another addition to the Expected Return Table which you may have noticed is a projection for every BDC of what we think Net Asset Value Per Share (NAVPS) will look like at the end of 2027. We thought this would make a useful companion metric to our dividend projection. For every BDC, we've looked at historical NAVPS trends since the end of 2017 - drawn from the BDC NAV Change Table in the BDC Reporter.
Into The Pot
We've combined that data with what we've learned over at the BDC Credit Reporter about every BDC's credit underwriting and taken into account other factors that affect NAVPS such as accretive share issuances; stock buybacks; dividend policy, etc. The result is our best estimate of how all our BDCs will fare in maintaining, increasing, or decreasing their net book value over time - a critical element in performance. For the record, 14 BDCs have managed to increase their NAVPS over the last half decade and 8 have kept their loss to under (10%). Another 10 have seen their NAVPS drop between (10%-20%). As with our dividend projections, we'll occasionally amend our NAVPS estimate as conditions change and note the alteration in the Expected Return Table, in the BDC Updates, and/or in these Snapshots.
Coming Up
Now that IQ 2023 BDC earnings season is over and we've had a chance to review every BDC's latest results in-depth, we'd like to take on a new challenge that readers might find interesting. We will shortly be launching a BDC Best Ideas portfolio.
Our Own Ark
Like Noah, we will include the two top BDCs from each of the five business segments into which we've divided our coverage universe: lower middle market; middle market, upper middle market; venture debt, and "hybrid". (This will save us from getting bogged down in the endless debate about which segment of the lending market is the most attractive). We're going to do this quantitatively, choosing the top performers in each segment rather than plumping for personal favorites. After all - in theory - the expected returns are supposed to be risk-adjusted for all factors and the highest returns should be the best buys. (In real life it never works out that way as every investor - ourselves included - has their biases, both those they are aware of and those they are not).
Test Run
We offer the portfolio as much an experiment as anything else to see if we can achieve over the long term a better total return than the S&P BDC Index. We'll have 5 years to find out and will re-invest dividend proceeds quarterly. Moreover - and to keep this interesting as they say - we'll be funding the portfolio with real money: $10,000 from our personal resources. At the moment, we plan to launch a new Best Ideas portfolio every quarter shortly after all results are in and track the performance of each over time.
Be Careful
We hope these Best Ideas portfolios can also serve as a starting point for any reader investing in BDCs for their own account. Remember, though, that these Best Ideas might not be suitable for your purposes, time frame or risk tolerance. Our projections may turn out to be way off and the assumptions we are using to calculate Target Prices could be mistaken.
End Of The Road
Finally, BDC Best Ideas is coming to the end of its beta phase. Starting in the week ahead, we'll be moving to a subscriber-only format. To justify the time and energy we're spending on what we believe is a unique resource for BDC investors, we need to charge a monthly subscription. Like all our publications, we have kept the cost very low at $50 a month, with no long-term commitment. This gives you access to all our content -including the Expected Return Table and the upcoming Best Ideas portfolio(s).
Final Pitch