BDC Common Stocks Market Recap: Week Ended October 17, 2025
Re-Printed From The BDC Reporter
October 19, 2025
Confused
BDC COMMON STOCKS
Week 42
It was a topsy-turvy week for Wall Street, though the three major averages managed to post solid gains. Market participants digested ongoing trade tensions between the U.S. and China, a government shutdown that shows no sign of ending, the start of the third quarter earnings season, and a scare over the health of regional banks.
For the week, the S&P (SP500) gained +1.7%, while the blue-chip Dow (DJI) added +1.6%. The tech-heavy Nasdaq Composite (COMP:IND) advanced +2.1%.
seeking alpha – wall street breakfast – October 17, 2025
Undecided
By week’s end, the BDC sector – as measured by BIZD, its only exchange traded fund – was up a solid 3.6%.
[BTW, the S&P BDC Index on a price basis increased 3.4%].
However, the “price action” intra-week was not so clear-cut.
As this 5 day stock price chart of BIZD shows, the sector roared back in in the first two and a half trading days.
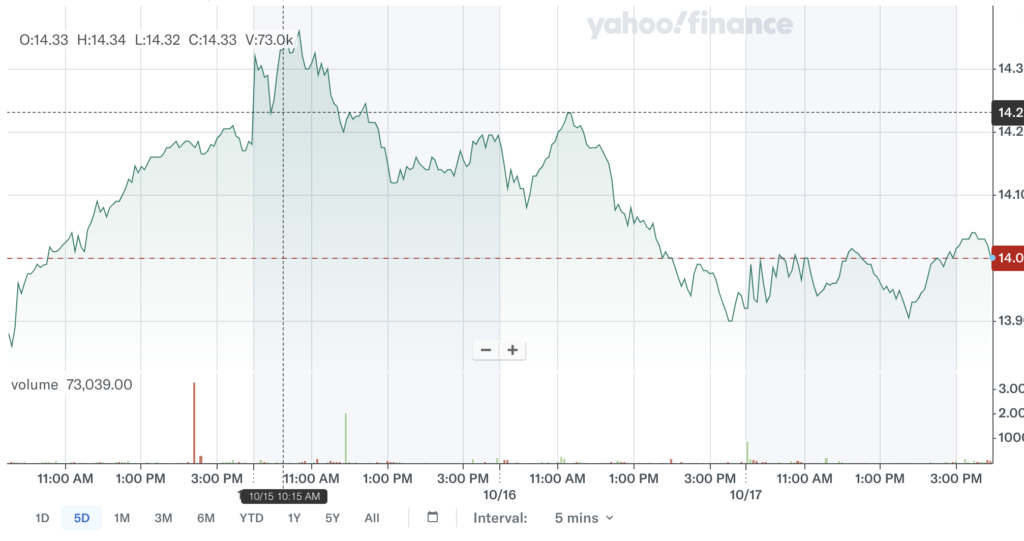
At its peak, BIZD was up 6.5% over the close on the prior Friday.
What’s more, trading volume was high – just as high as the week before when prices were tumbling – a suggestion that some of the price movement is tactical as investors move in and out, seeking advantage.
However, BIZD began to falter thereafter and fell back significantly – (3.8%) – before closing out the week a little stronger.
Noteworthy – and suggesting that this may have been a false dawn for BDC investors hoping for an end to the market pullback – 5 BDCs reached a new 52 week low during the week.
We also noticed that the number of BDCs trading at or above book net asset value per share (NAVPS) increased by only one: from 6 to 7.
Other Metrics
Anyway, 38 BDCs ended the week in the black – a robust result after 6 weeks where decliners far outnumbered gainers.
Of the BDCs in the black, 23 were up more than 3.0% – the best weekly result by that measure since May.
On the other hand, 2 BDCs did yet manage to drop in price by more than (3.0%): Great Elm Capital (GECC) and OFS Capital (OFS).
We discussed GECC at length last week in the Recap. Its continuing price decline should be no great surprise as the news continue to spill out gory details about the First Brands wreck that the BDC is part of.
Inescapable
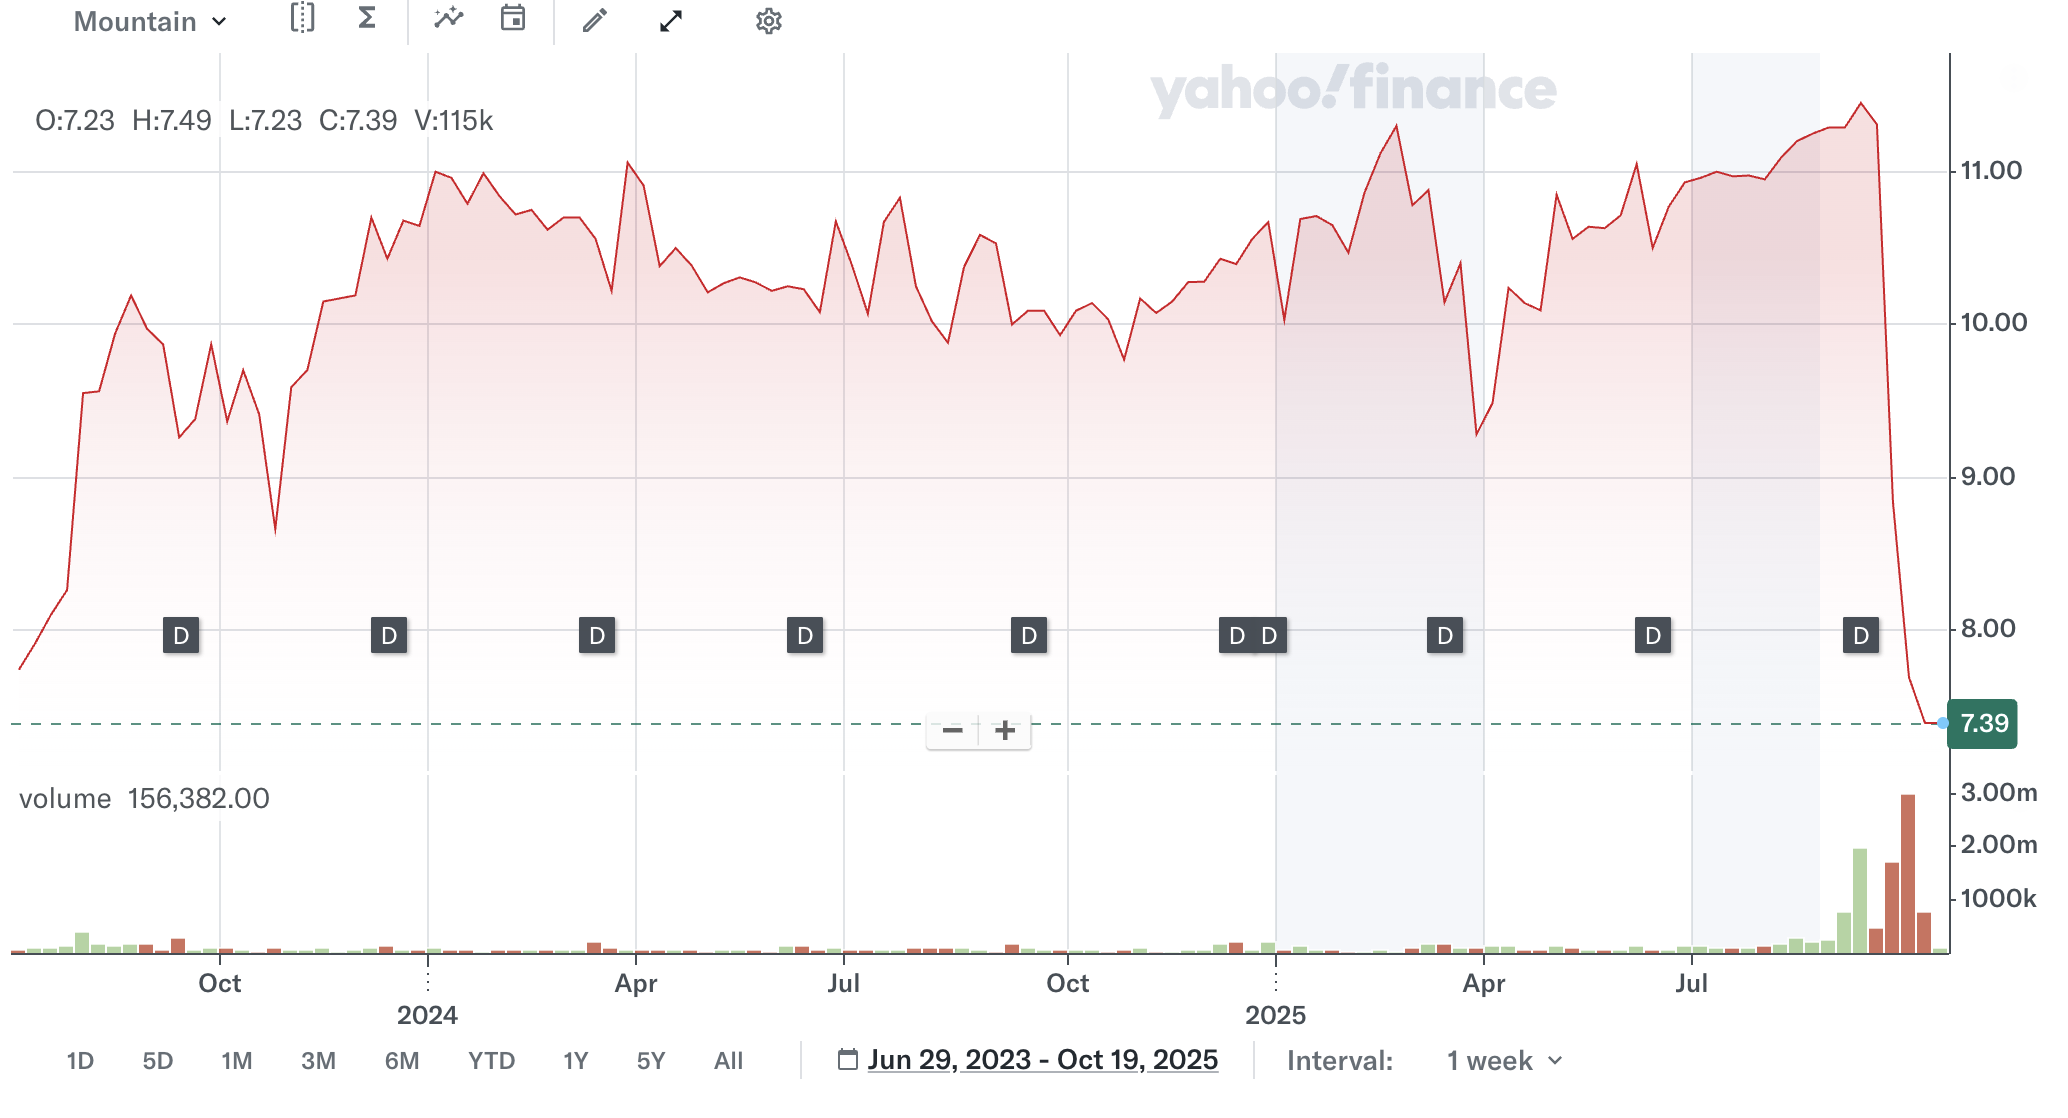
The price decline at OFS is based on simple mathematics, rather than on any news development.
The lower middle market BDC is now trading at a level not reached since 2021 and currently yields nearly (20%) – a sure sign that investors do not expect its current $0.34 regular quarterly dividend to hold.
You can’t blame investors for being skeptical.
In the most recent quarter, the BDC’s Net Investment Income Per Share (NIIPS) was only $0.25.
In 2026, the analyst consensus is that OFS will earn only $0.78, or less than $0.20 a quarter.
That could explain why OFS closed the week at a price of $6.95.
The $0.25 per share in spillover income won’t last long with that sort of variance between payout and recurring earnings.
The BDC Reporter has written about OFS multiple times in recent weeks.
By The Way
Without being alarmist about a BDC that has been active since 2007 and public since 2012, we remain concerned about more than lower earnings and distributions – but liquidity.
The BDC has recently seen its secured Revolver decrease in size from $150mn to $80mn and extended only until September 30, 2025.
See the BDC Reporter article: “OFS Capital: What’s Happening To The BNP-Led Revolver”, written on August 26, 2025.
We’ve checked the BDC’s SEC Filings and press releases of recent weeks and found no word of any extension of the Revolver or any new financing facility.
More will be learned when OFS reports its latest results.
WHERE WE ARE
Maybe. Maybe Not
BDC investors must be breathing a little easier after this first week in the black in a long time.
However, the sector’s recent loss of popularity has caused much damage in a shortish period.
Let us review some of the lowlights.
BIZD – on a price basis – is down (16.0%) in 2025 YTD and, from its brief price height in February, is down (21.8%) – “Bear Territory” for those who use this ursine categorization.
Even when we figure in distributions received, BIZD is off (8.36%) on a total return basis.
This is confirmed by the total return of the S&P BDC Index, off (8.37%).
Individual Performance
Seeking Alpha indicates only 3 BDCs are in the black price-wise in 2025 after 42 weeks.
The rest are in the red, including 25 more than (15%) down and 8 off by (30%) or more.
What little good news we have to report is that Sharesight calculates that 10 BDCs are in the black on a total return basis.
Here’s the list:
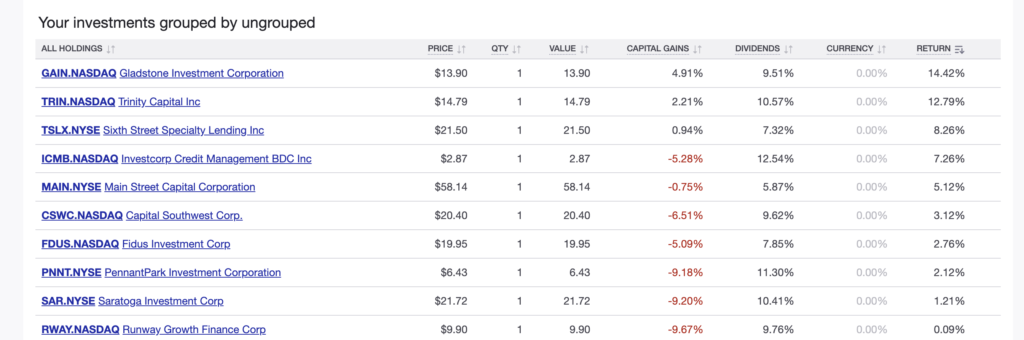
Where Are They Now ?
You’ll notice that missing from the list above are any BDCs – including the sector’s GOAT Ares Capital (ARCC) – serving the upper middle market (UMM).
War Of The Words
That’s the segment of the market most in the news these days as Jamie Dimon – on Team Banks – has been exchanging barbs with asset managers like Blue Owl, Apollo, Carlyle and Blackstone – representing Team Private Credit.
This follows the loss booked by JP Morgan on auto lender Tricolor.
Dimon warned of more “cockroaches” after the Tricolor and First Brands implosions.
Throwing gas on the fire was the news that two regional banks were defrauded by a commercial real estate borrower and, for a minute or two, the markets went into credit shock.
Finger In Chest
JP Morgan – which was once saw its role as calming and guiding the financial community – is taking a different tack under Dimon.
Besides his cockroach analogy – cribbed from an expression Warren Buffet is famous for – he pointed directly at BDCs with this:
“Look at the price of the BDCs [business development companies] and their publicly traded private credit facilities and do the homework.”
This was less about BDCs really than supposed evidence that credit conditions are shaky and – according to Dimon – potentially getting shakier.
The financial news had a field day warning of “cracks” in private credit – including BDCs – and even worrying about the sturdiness of all the BDCs secured Revolvers financed by the banks.
(That’s a strange fascination of both Elizabeth Warren and the IMF – both of whom have been expressing great concern fo r some time).
For a brief article on the subject, click here.
Rebuttal
We don’t have room to discuss the Dimon matter at great length here so we’re going to cut to the chase:
This whole episode is ridiculous and the failures of Tricolor, First Brands and the real estate deals are all clearly instances of credit fraud rather than the result of broad based economic weakness.
There may be a few more “cockroaches” that come out of this as lenders look harder at their their borrowers but in an economy with tens of thousands of borrowers that’s immaterial.
Moreover, the institutions that had the wool most pulled over their eyes are the banks (including JP Morgan) and a miscellany of other sort of specialized trade lenders.
Private credit has virtually no exposure and the same can be said about the BDCs, as detailed in an earlier article. Of the 3 failures, BDCs are involved only in First Brands and their exposure amounts to less than 1% of the capital involved.
As to the decline in BDC stock prices or the recent reduction in the quarterly dividend of the largest non-traded BDC, we’re confident that most of the impetus – as we’ve discussed here – is the expected future course of interest rates rather than credit concerns.
Done The Homework
Over at the BDC Credit Reporter we identify the worst performing BDC-financed every day based on BDC disclosures and the private record.
Admittedly, with the exception of Saratoga Investment (SAR) we don’t have the latest valuations of the near 10,000 companies financed by BDCs.
However, the data we have from the IIQ 2025, and from the many sources of more recent news, does not suggest ANY material increase in credit stress across these non-investment grade companies.
Front Line
At the moment we can only identify 137 “Important Underperformers” – BDC-financed companies with an aggregate value over $5mn and deemed more likely than not to ultimately result in a material realized loss.
These Important Underperformers have an aggregate FMV of $6.5bn but that’s only 1.3% of the FMV of all BDCs.
Valuable
If you’re not convinced by our metrics, then there are these numbers from Advantage Data:
BDCs of all stripes have invested $481.4bn at cost, as reported in their filings.
The fair value of those investments comes to $481.7bn, a premium to cost.
(We undertook this same analysis just for the 46 public BDCs we track and came to the same result – a very slight premium to cost).
Are all these BDCs inflating the value of their positions or is the sector sound?
We clearly believe the latter.
Credit conditions could get worse going forward if only because conditions have just been so good for so long.
However, we are far from the conditions that some would have us believe are right right round the corner.
And shame on the financial press for fear mongering to sell a few more clicks.
A little context and “calling around” would have gone a long way.
WHERE WE ARE HEADED
Any Which Way
We’ve seen BDC market rebounds before.
Sometimes we get days and days of higher prices as investors jump back in to the market after some potential meteorite passes by without causing the expected damage. Think Covid.
At other times, we get the “dead cat” bounce – like that lift early last week and then continue our descent.
At yet other times – and this is the most likely scenario here – investors remain undecided, regularly coming in and out, influenced by macro factors that have very little to do with BDC fundamentals.
It’s Been Said Before
The Big Unknown is where interest rates will go over in the rest of 2025 and – especially – in 2026.
We all have an opinion and so does everyone at the Federal Reserve it seems and then there’s the Administration to consider.
To say that there is no consensus – as Bloomberg wrote about this week in an excellent article – is understating the matter.
As a result, BDC prices could move with every shift in the “zeitgeist” and every new economic data point that we receive from private and public sources.
We’ll continue to chronicle these ups, downs and sideway moves in this weekly Recap and in the occasional article if we get a sizable shift.
What Really Matters
However, most of our attention will be on determining how the fundamental financial performance of the public BDCs is changing – for good or ill.
After all, BDC earnings season is right round the corner.
We know a little already thanks to SAR’s results through August and earnings previews from Capital Southwest (CSWC) and Main Street Capital (MAIN);some updates woven into the prospectuses of BDCs raising new debt and Palmer Square Capital‘s (PSBD) monthly NAV Per share announcement.
Still, there’s a great deal more to learn and we expect there will be wide variations between the various players even if the market seems to have turned their back on all of them.